In the modern cloud-native world, visibility is everything. You can’t manage what you can’t measure. But for developers and homelab enthusiasts running on a budget or prioritizing efficiency, the massive resource footprint of traditional x86 monitoring tools can be a deal-breaker. What if you could have enterprise-grade monitoring, beautiful dashboards, and centralized logging without the high costs and power consumption?
Enter the ARM VPS. These low-power, cost-effective servers are no longer just for experiments; they are powerful enough to act as the central nervous system for your entire infrastructure. In this guide, we’ll deploy a full-featured, lightweight monitoring stack on an ARM VPS to keep tabs on your systems, applications, and services.
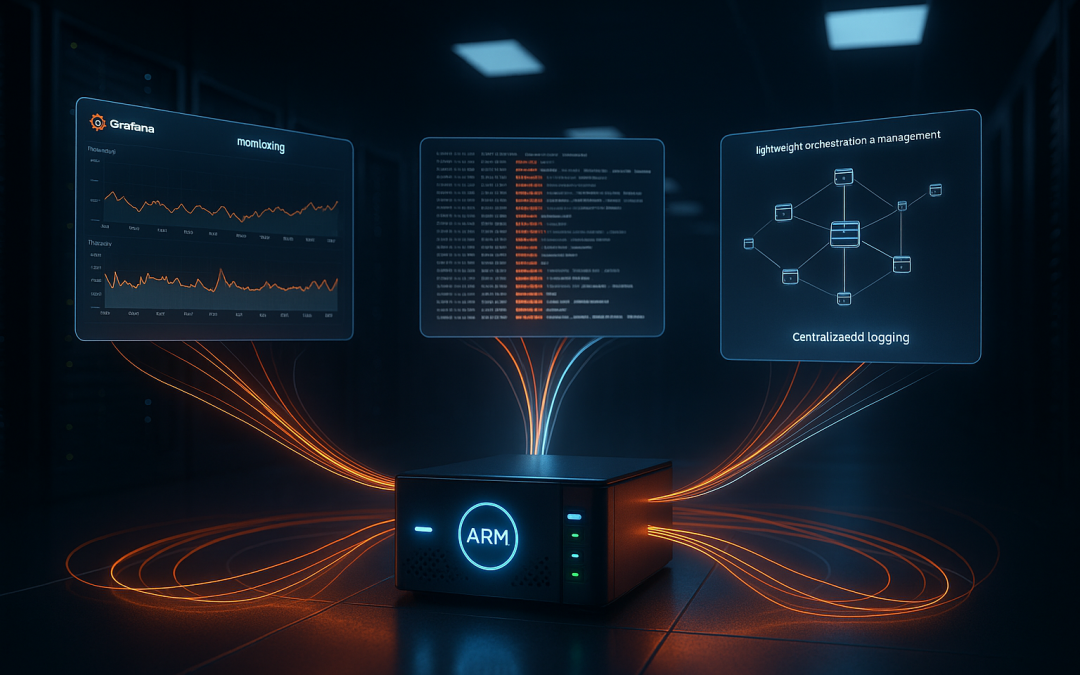
Why an ARM VPS is Perfect for Your Monitoring Stack
Before we dive into the commands, let’s explore why an ARM VPS is an ideal choice for this task:
- Cost Efficiency: ARM VPS offerings from providers like VPS Zen are significantly cheaper than their x86 counterparts. This allows you to run a dedicated monitoring node without blowing your budget.
- Power Efficiency: ARM architecture is inherently more power-efficient. This means lower electricity bills for home-labs and a smaller carbon footprint for eco-conscious teams.
- Adequate Performance: Modern ARM CPUs (like ARMv8 and higher) offer plenty of performance for collecting, storing, and visualizing time-series data and logs from multiple sources. They handle the constant, small I/O operations of monitoring tools exceptionally well.
- Silent Operation: For home-labs, a low-power ARM board or VPS means a cool, silent-running monitoring solution.
Our Lightweight Toolchain Overview
We’ll combine several best-in-class, open-source tools that are known for their efficiency and scalability.
- Prometheus: The cornerstone of our stack. This time-series database pulls and stores metrics data from configured “exporters.” It’s highly efficient and reliable.
- Grafana: The visualization layer. Grafana connects to Prometheus (and other data sources) to create beautiful, insightful dashboards for your metrics.
- Grafana Loki: A log aggregation system inspired by Prometheus. It’s designed to be cost-effective and easy to operate, indexing only metadata from your logs.
- Promtail: The agent that ships the contents of local logs to a Loki instance. It’s what we’ll use to get logs from our VPS to Loki.
- Cockpit: A server management interface that provides a great web-based overview of a single machine’s health (CPU, Memory, Disk I/O, Network, etc.).
- Netdata (Optional): A real-time, high-resolution health monitoring and performance troubleshooting tool. It provides incredible detail out-of-the-box but uses more resources. We’ll install it as an optional component.
Prerequisites
- An ARM VPS running Ubuntu 22.04 LTS or Debian 11/12 (the commands will be for a Debian-based system).
- SSH access to your VPS with a non-root sudo user.
- A domain name pointed to your VPS (optional but recommended for securing web interfaces with SSL).
Phase 1: Server Preparation and Security
First, connect to your VPS and ensure it’s up to date.
sudo apt update && sudo apt upgrade -y
sudo apt install -y apt-transport-https software-properties-common
Crucial Security Step: While we will secure individual services, a firewall is non-negotiable.
# Install UFW (Uncomplicated Firewall)
sudo apt install ufw

# Set default rules: deny all incoming, allow all outgoing.
sudo ufw default deny incoming
sudo ufw default allow outgoing

# Allow SSH to prevent locking yourself out.
sudo ufw allow ssh

# Allow HTTP/HTTPS for our web interfaces (we'll secure them later).
sudo ufw allow 80/tcp
sudo ufw allow 443/tcp

# Enable the firewall. Double-check you've allowed SSH!
sudo ufw enable
Phase 2: Deploying the Monitoring Stack
We’ll use Docker and Docker Compose for easy management and isolation of our services. First, install Docker:
# Add Docker's official GPG key and repository for ARM
curl -fsSL https://get.docker.com -o get-docker.sh
sudo sh get-docker.sh
sudo usermod -aG docker $USER
# Log out and back in for group changes to take effect.
Now, create a directory for our stack and a docker-compose.yml file.
mkdir ~/monitoring-stack && cd ~/monitoring-stack
nano docker-compose.yml
Paste the following configuration. This file defines our Prometheus, Grafana, and Loki containers with persistent storage.
version: '3.8'

services:
  prometheus:
    image: prom/prometheus:latest
    container_name: prometheus
    restart: unless-stopped
    volumes:
      - ./prometheus:/etc/prometheus
      - prometheus_data:/prometheus
    command:
      - '--config.file=/etc/prometheus/prometheus.yml'
      - '--web.enable-lifecycle'
    ports:
      - "9090:9090"
    networks:
      - monitoring

  grafana:
    image: grafana/grafana:latest
    container_name: grafana
    restart: unless-stopped
    ports:
      - "3000:3000"
    volumes:
      - grafana_data:/var/lib/grafana
      - ./grafana/provisioning:/etc/grafana/provisioning
    environment:
      - GF_SECURITY_ADMIN_PASSWORD=ChooseAStrongPasswordHere!
      - GF_USERS_ALLOW_SIGN_UP=false
    networks:
      - monitoring

  loki:
    image: grafana/loki:latest
    container_name: loki
    restart: unless-stopped
    ports:
      - "3100:3100"
    command: -config.file=/etc/loki/local-config.yaml
    volumes:
      - loki_data:/loki
    networks:
      - monitoring

  promtail:
    image: grafana/promtail:latest
    container_name: promtail
    restart: unless-stopped
    volumes:
      - /var/log:/var/log
      - ./promtail:/etc/promtail
    command: -config.file=/etc/promtail/config.yaml
    networks:
      - monitoring

volumes:
  prometheus_data:
  grafana_data:
  loki_data:

networks:
  monitoring:
    driver: bridge
Create the necessary config files. First, create a basic prometheus.yml:
global:
  scrape_interval: 15s

scrape_configs:
  - job_name: 'prometheus'
    static_configs:
      - targets: ['localhost:9090']
  # We will add more targets (like the host machine) later
Now, create a Promtail config to send syslog to Loki:
mkdir promtail
nano promtail/config.yaml
server:
http_listen_port: 9080
grpc_listen_port: 0
positions:
filename: /tmp/positions.yaml
clients:
- url: http://loki:3100/loki/api/v1/push
scrape_configs:
- job_name: system
static_configs:
- targets:
- localhost
labels:
job: varlogs
__path__: /var/log/*logFinally, start the entire stack:
docker compose up -dYour core stack is now running! Access them at:
- Prometheus:
http://your-vps-ip:9090 - Grafana:
http://your-vps-ip:3000(login:admin/ChooseAStrongPasswordHere!) - Loki:
http://your-vps-ip:3100(ready endpoint)
Phase 3: Installing and Configuring Host Monitoring
Install Cockpit
Cockpit is installed directly from the package manager and provides excellent single-host visibility.
sudo apt install cockpit -y
sudo systemctl enable --now cockpit.socket
# Cockpit runs on port 9090. We need to open it in UFW.
sudo ufw allow 9090/tcp
Access Cockpit at https://your-vps-ip:9090 (note the https).
Install the Node Exporter
To get host metrics (CPU, memory, disk) into Prometheus, we need the Node Exporter. Since it needs direct host access, we’ll install it directly on the VPS, not in Docker.
# Download the latest ARM64 node exporter
wget https://github.com/prometheus/node_exporter/releases/download/v1.6.1/node_exporter-1.6.1.linux-arm64.tar.gz
# Extract it
tar xvfz node_exporter-1.6.1.linux-arm64.tar.gz
# Move the binary to your system path
sudo mv node_exporter-1.6.1.linux-arm64/node_exporter /usr/local/bin/
# Create a systemd service file to manage it
sudo nano /etc/systemd/system/node_exporter.service
Paste the following into the service file:
[Unit]
Description=Node Exporter
After=network.target

[Service]
User=node_exporter
Group=node_exporter
Type=simple
ExecStart=/usr/local/bin/node_exporter

[Install]
WantedBy=multi-user.target
Create the user and start the service:
sudo useradd -rs /bin/false node_exporter
sudo systemctl daemon-reload
sudo systemctl enable --now node_exporter
Now, update your prometheus/prometheus.yml file to scrape the Node Exporter. Add a new job:
scrape_configs:
  - job_name: 'prometheus'
    ... # existing config
  - job_name: 'node'
    static_configs:
      - targets: ['your-vps-ip:9100'] # The Node Exporter's default port
Tell Prometheus to reload its config by sending a HTTP POST request (cURL makes this easy):
curl -X POST http://localhost:9090/-/reloadPhase 4: Centralized Logging and Metrics Best Practices
Connecting Grafana to Data Sources
- Log in to Grafana (
http://your-vps-ip:3000). - Go to Configuration > Data Sources.
- Add data source:
- Prometheus: Set the URL to
http://prometheus:9090(This uses Docker’s internal networking). - Loki: Set the URL to
http://loki:3100.
- Prometheus: Set the URL to
Building Your First Dashboards
Instead of building from scratch, import community-made dashboards.
- In Grafana, go to Create > Import.
- For host metrics, use Dashboard ID
1860(Node Exporter Full). Load it and select your Prometheus data source. - You now have a comprehensive dashboard for your ARM VPS host!
For logs, go to Explore in the left menu. Select the Loki data source. You can start querying your logs with LogQL, try {job="varlogs"} to see all system logs.
Best Practices
- Secure Your Services: Use a reverse proxy like Nginx with Let’s Encrypt SSL certificates to password-protect and encrypt access to Prometheus, Grafana, and Cockpit. Exposing them raw on the internet is a major security risk.
- Retention Policies: In Prometheus, configure
--storage.tsdb.retention.timeto define how long to keep metrics. 90-180 days is a good starting point for small setups. - Regular Backups: Back up your
docker-compose.ymlfile and any custom configuration directories. The Docker volumes hold your data.
Essential Monitoring Dashboards to Configure
With your stack running, focus on these key dashboards:
- Host Overview: Your imported Node Exporter dashboard tracks the core health of your VPS: CPU, Memory, Disk I/O, Network Traffic, and Load Average.
- Prometheus Status: Create a simple dashboard to monitor Prometheus itself (e.g., ingestion rate, memory usage) to ensure your monitoring system is healthy.
- Application Logs: Use the Explore view in Grafana with Loki to quickly filter logs for errors (e.g.,
{job="varlogs"} |= "error"). - Uptime Monitoring: Use a simple Grafana graph with the query
upfrom Prometheus. A value of1means the target is healthy;0means it’s down.
Conclusion: Your Efficient Monitoring Hub is Live
You’ve successfully transformed a low-cost ARM VPS into a powerful, centralized monitoring hub. You are now collecting critical system metrics with Prometheus, visualizing them with stunning Grafana dashboards, aggregating logs with Loki, and managing the host itself with Cockpit.
This stack is not just cost-effective; it’s incredibly versatile. You can now easily add monitoring for other services—like databases, web servers, or even other VPSs—by simply installing exporters on those machines and pointing your Prometheus configuration at them. Your lightweight ARM monitor is ready to scale with your needs, ensuring you have full visibility over your infrastructure without the heavyweight price tag.
vpsplug